Emerging Markets M&A Monitor
By EMIS M&A Team
The EMIS database contains 180,000+ M&A and ECM deals with proprietary research and forecasts and is a part of a broader information platform which also contains company, sector and macroeconomic intelligence for a range of emerging markets.
EMIS Insights M&A
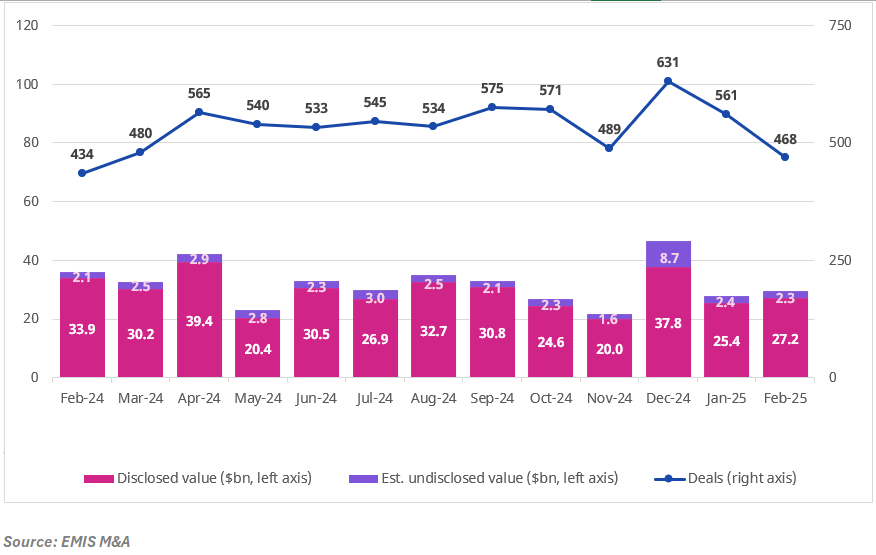
The data below is an accumulation of deal flow within each month, including both disclosed and estimated undisclosed deal value.
February 2025
Regions covered include Central & Southeast Europe, Africa & the Middle East, The Caucasus & Central Asia, Latin America & the Caribbean, and Asia Pacific.

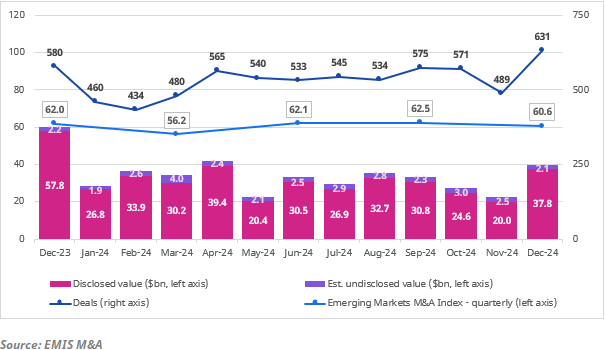
2024
EMIS M&A Quarterly Index Methodology
The EMIS M&A Index is a single, easy to understand quarterly indicator of mergers and acquisitions activity across global emerging markets. It shows how M&A develops in each quarter since the beginning of 2015 when the index was launched with a baseline value of 100.

The overall index is comprised of four weighted components, with more weight given to cross-border M&A and to M&A volume: - Cross-border M&A volume (35% weight) - Domestic M&A volume (25% weight) - Cross-border M&A value (25% weight) - Domestic M&A value (15% weight) M&A volume is defined as the number of announced M&A deals. M&A value is defined as the total US dollar value (excluding net debt) of announced M&A deals. Cross-border M&A is defined as activity where one of the deal sides is from a different country. Regions covered include Central & Southeast Europe, Middle East & Africa, The Caucasus & Central Asia, Latin America & the Caribbean, and Emerging Asia.
Are you interested in M&A intelligence? Request a demo of our platform here
